
School Budgeting
How Do Schools Forecast Tuition Revenue? A Practical Guide for Finance Teams
A step-by-step look at how to move from student numbers and published fees to the tuition a school can actually expect to collect.
October 21, 2026
Quick Answer
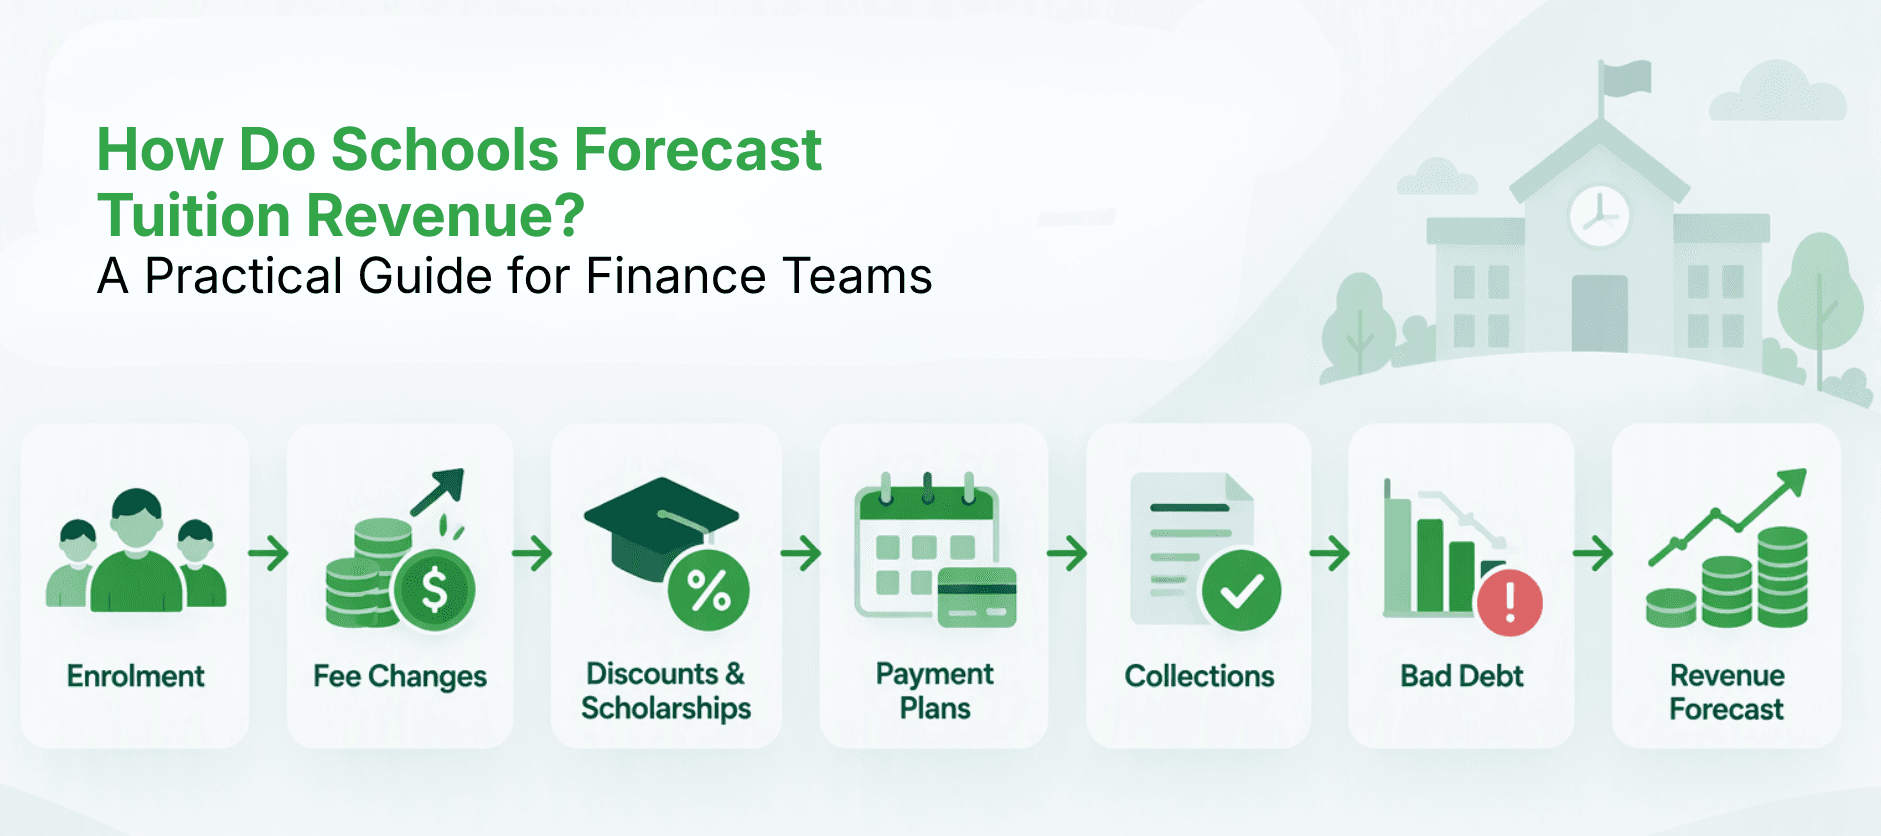
Tuition revenue forecasting starts with forecast enrolment by year level and the fee for each year level, then adjusts for what actually reaches the school: sibling and staff discounts, scholarships and bursaries, payment plans, collection rates and bad debt. The result is a net, collected figure rather than the headline fee total. Each assumption should be recorded with its source, so the forecast can be updated quickly when any of them changes.
Key Takeaways
- School tuition forecasting starts with enrolment and fees, but the figure that matters is what the school expects to collect.
- Discounts, scholarships, payment plans and bad debt each move the result, so each needs its own assumption.
- Record the source of every assumption so the forecast can be updated quickly when one changes.
The fee schedule says the senior fee is 18,000, and the budget shows tuition revenue built from it. Months later the number that has actually arrived is lower, and nobody has done anything wrong. A few families receive sibling discounts. Several students hold scholarships or bursaries. One family on a payment plan has a final instalment that lands next year, and one account has been written off.
The business manager can explain every one of those differences. The challenge is that each one lives in a different place: the fee schedule, the discount list, the scholarship register, the payment plan data and the receivables ledger. A good school revenue forecast brings them together before the year starts, not after.
How Do Schools Forecast Tuition Revenue Accurately?
Accuracy comes from working through the steps in order, with a separate assumption at each one. Most schools follow a version of this sequence:
- Start with forecast enrolment by year level: the student numbers from your enrolment forecast, split by year level.
- Apply the fee for each year level: including the planned fee change for next year.
- Subtract sibling and staff discounts: based on the number of families who qualify.
- Subtract scholarships and bursaries: using awards already made and an allowance for those still to come.
- Allow for payment plans: so you know not only how much arrives, but when.
- Apply a collection assumption and bad debt allowance: based on your own history and current receivables.
- Record each assumption and test it: with a source, an owner and a date, and at least one scenario.
What Is the Difference Between Gross, Net Billed and Collected Tuition?
A tuition forecast can describe three different figures, and it helps to show all three:
| Measure | What It Means | What It Is Used For |
|---|---|---|
| Gross tuition | Forecast students multiplied by the published fee for each year level. | The headline figure and the starting point for every adjustment. |
| Net billed tuition | Gross tuition less discounts, scholarships and bursaries. | What families are actually invoiced, and usually the revenue figure in the budget. |
| Collected tuition | Net billed tuition less bad debt and amounts collected after the year ends. | What the school expects to receive in the year, which matters for cash planning. |
How Do Fee Changes, Discounts and Scholarships Affect the Forecast?
Each adjustment is small on its own, but together they make a real difference between the headline and the result. Here is an illustrative example, starting with the 10,480,000 gross tuition from the enrolment example and applying simple assumptions:
| Step | Assumption | Amount |
|---|---|---|
| Gross tuition | Students multiplied by the fee for each year level | 10,480,000 |
| Sibling and staff discounts | 2.5% of gross tuition | -262,000 |
| Scholarships | 1.5% of gross tuition | -157,200 |
| Bursaries and fee assistance | 2.0% of gross tuition | -209,600 |
| Net billed tuition | 9,851,200 | |
| Bad debt written off | 1.0% of net billed tuition | -98,512 |
| Collected after year end | 1.0% of net billed tuition | -98,512 |
| Expected tuition collected in the year | 9,654,176 |
In this example the school expects to collect about 92.1% of the headline fee total in the year, which is roughly 826,000 less than the gross figure suggests. The sensitivity is also worth noticing. A one percentage point change in the scholarship allowance moves gross tuition by 104,800, before any collection effects.
Fee changes work in the other direction. A planned increase applies to every student, so it is usually the biggest single lever in the forecast, and it should be checked against both the discount assumptions and the enrolment outlook.
How Do Payment Plans Change When the Money Arrives?
Payment plans do not change how much tuition is billed, but they change when it is received. Families who pay annually in advance bring cash in early, families who pay each term spread it across the year, and families on monthly instalments spread it further.
Here is a simple example. If 20% of families pay upfront, 50% pay each term and 30% pay monthly, then term one receives 40% of the year's collectible tuition, and each of the other three terms receives 20%. A forecast that assumes an even quarter in each term would understate early cash and overstate later cash, which matters when the school is planning for payroll and capital payments.
What Should You Assume About Collection and Bad Debt?
Your own history is the best starting point. Look at how much of the net billed tuition was collected within the year over recent years, how much arrived after the year end, and how much was eventually written off. Keeping those two amounts separate is useful, because late collection is a timing difference while a write-off is a permanent loss.
Then adjust for what is happening now. The receivables report and the age of outstanding balances give early signs of whether collection is holding up. If families are under more financial pressure than in previous years, the forecast should say so, rather than quietly carrying last year's rate forward.
Why Is Tuition Revenue Forecasting Hard to Keep Current?
Because the inputs change in different places and at different times. Enrolments move as confirmations arrive, the fee schedule changes once a year, scholarships are awarded in batches, and collection results come in every month. Each change has to be carried into the revenue forecast, which in a file-based process usually means updating more than one workbook.
None of this reflects a lack of skill. Finance teams do careful work with the information they are given. The strain comes from the structure, where the pieces of the forecast live in separate files that have to be kept in step.
Which Assumptions Should You Record?
You can make tuition revenue planning easier without changing any tools. These habits help, and they are the thinking behind the calculator and assumption sheet at the end of this post:
- Record the source, owner and date for every assumption: so anyone can see where a number came from and when it was last checked.
- Forecast gross, net billed and collected separately: so the effect of each adjustment is visible.
- Keep discounts, scholarships and bursaries on separate lines: because they are decided by different people and behave differently.
- Compare the collection assumption with actual receivables each term: so drift is caught early.
- Update the forecast when enrolment or fees change: so revenue never lags behind the decisions that drive it.
Now Imagine the Version That Works
Imagine changing the fee increase once and watching gross tuition, net billed tuition, expected collections and cash by term all update together. When enrolment changes, the revenue forecast follows without anyone copying numbers across. The assumptions sit in one place, each with its source and date, so the next person to pick up the forecast knows where everything came from.
That's what PULSE is built to support: a planning, budgeting, forecasting and reporting platform built for schools, where enrolment, fees and collection assumptions feed one connected forecast. It works alongside the school's finance system, existing workbooks can be the starting point, and the finance team keeps control of every assumption.
The judgement about what the assumptions should be still comes from people who know the school and its families. The difference is that more of their time goes into that judgement, and less into carrying changes from file to file.
Frequently Asked Questions
They start with forecast enrolment by year level and the fee for each, then adjust separately for discounts, scholarships and bursaries, payment plans, collection and bad debt. Recording the source of each assumption and testing at least one scenario also improves accuracy.
Related Articles
- School BudgetingHow Do Schools Forecast Enrolment and Turn Student Numbers Into a Revenue Plan?
- School BudgetingWhat Should Be in a School Board Financial Report? 7 Reports Finance Teams Should Track
- School BudgetingSchool Budget Variance Analysis: How Do You Explain Actual vs Budget to the Board?
- School BudgetingHow Can Schools Consolidate Department Budgets Without Chasing 50 Spreadsheets?
- School BudgetingSchool Budgeting in Excel: What Works, What Gets Difficult, and When to Change?

- School BudgetingHow Do You Build a School Budget? A Step-by-Step Guide for Finance Teams

- School BudgetingSchool Budget vs Forecast: What's the Difference and When Should You Use Each?
- School BudgetingSchool Budget Template: What Should a School Budget Include?